Thermal resistance calculation for a ceramic PCB substrate starts with Fourier’s one-dimensional formula: Rθ = t / (k × A), where t is substrate thickness, k is thermal conductivity, and A is the heat-spreading area. For a 0.635 mm thick, 10 × 10 mm pad of 96% alumina (k ≈ 25 W/m·K), the substrate’s conduction resistance is roughly 0.25 °C/W. That single number rarely tells the whole story — you also need the die-attach, copper layer, and convection resistances to predict junction temperature.
Key Takeaways
- Substrate conduction resistance (Rθ_sub) is typically the smallest term in the full junction-to-ambient thermal stack for ceramic boards.
- Switching from 96% Al₂O₃ (24–28 W/m·K) to AlN (170–200 W/m·K) cuts Rθ_sub by roughly 7×, but the convection-side resistance often dominates total Rθ_ja.
- Die-attach layers (solder, epoxy, or sintered silver) can add 0.1–3.0 °C/W depending on material and bond-line thickness.
- A filled thermal via array under a QFN can reduce the effective through-board resistance by 40–70 % compared to bare ceramic.
- Always validate hand calculations with a thermal simulation for ceramic boards before committing to production.
The One-Dimensional Thermal Resistance Calculation Formula
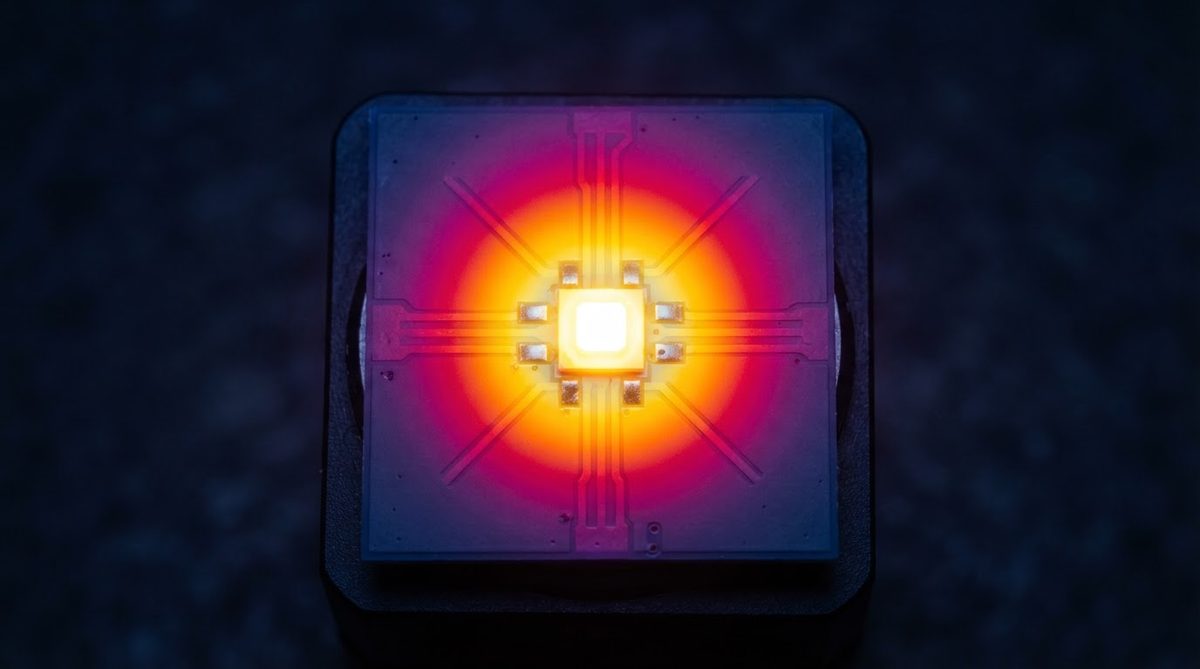
Thermal resistance through a flat slab of material is defined by Fourier’s law in one dimension:
Rθ = t / (k × A)
- Rθ — thermal resistance (°C/W or K/W)
- t — thickness of the layer (m)
- k — thermal conductivity of the material (W/m·K)
- A — cross-sectional area perpendicular to heat flow (m²)
This formula applies to each layer in the stack: die attach, copper trace, ceramic substrate, solder to heatsink, and the heatsink itself. You sum them in series to get the total conduction path. Parallel paths — such as thermal vias alongside bulk ceramic — are combined as reciprocals, just like parallel resistors.
Building the Full Rθ_ja Stack for a Ceramic PCB
A typical power component mounted on a ceramic PCB has five to seven thermal resistance terms in series from junction to ambient. The table below lists each layer and a realistic range for a 10 × 10 mm heat source on a single-layer ceramic board.
| Layer | Symbol | Typical Range (°C/W) | Key Variable |
|---|---|---|---|
| Junction to case (inside the IC) | Rθ_jc | 0.5–5.0 | Package type; from IC datasheet |
| Die attach / solder layer | Rθ_da | 0.1–3.0 | Material (SAC305 ≈ 58 W/m·K; Ag sinter ≈ 200+ W/m·K), bond-line thickness |
| Top copper layer | Rθ_cu_top | 0.01–0.05 | Copper thickness (35–300 µm), area |
| Ceramic substrate | Rθ_sub | 0.03–0.50 | Material (Al₂O₃ vs AlN), thickness, area |
| Bottom copper / metallisation | Rθ_cu_bot | 0.01–0.05 | Same as top copper |
| TIM / solder to heatsink | Rθ_tim | 0.05–1.0 | TIM type, pressure, area |
| Heatsink to ambient (convection + radiation) | Rθ_sa | 2–20+ | Heatsink size, airflow, fin geometry |
Typical values for commercially available materials, for comparison only. Confirm against the datasheet for your specific grade.
Total junction-to-ambient resistance is: Rθ_ja = Rθ_jc + Rθ_da + Rθ_cu_top + Rθ_sub + Rθ_cu_bot + Rθ_tim + Rθ_sa. Notice that Rθ_sa (heatsink to ambient) is almost always the largest term. Improving the substrate material from alumina to AlN may save 0.2–0.4 °C/W, but a poorly chosen heatsink wastes 10× that.
Worked Example: 5 W LED on 96% Alumina
Suppose you mount a 5 W LED with Rθ_jc = 2.5 °C/W onto a 96% Al₂O₃ substrate, 0.635 mm thick, with a copper pad area of 8 × 8 mm (64 mm²). The board is soldered to an aluminum heatsink. Walking through each thermal resistance calculation step by step:
Step 1 — Substrate Conduction
k for 96% Al₂O₃ ≈ 25 W/m·K (per CoorsTek ADS-96R datasheet, measured at 25 °C per ASTM E1461).
Rθ_sub = 0.000635 m / (25 W/m·K × 0.000064 m²) = 0.397 °C/W
Step 2 — Die Attach (SAC305 Solder, 50 µm BLT)
k for SAC305 ≈ 58 W/m·K. A = 3 × 3 mm die = 9 mm².
Rθ_da = 0.00005 / (58 × 0.000009) = 0.096 °C/W
Step 3 — Top Copper (35 µm, 8 × 8 mm)
k for copper ≈ 390 W/m·K.
Rθ_cu = 0.000035 / (390 × 0.000064) = 0.0014 °C/W — negligible.
Step 4 — TIM to Heatsink (0.1 mm thermal grease, k = 5 W/m·K, 10 × 10 mm)
Rθ_tim = 0.0001 / (5 × 0.0001) = 0.20 °C/W
Step 5 — Heatsink to Ambient (natural convection, small fin array)
Rθ_sa = 8.0 °C/W (from heatsink vendor datasheet for a 25 × 25 × 10 mm extrusion in still air).
Step 6 — Sum
Rθ_ja = 2.5 + 0.096 + 0.001 + 0.397 + 0.001 + 0.20 + 8.0 = 11.2 °C/W
Junction temperature at 5 W, 25 °C ambient: T_j = 25 + (5 × 11.2) = 81 °C.
The substrate accounts for only 0.4 °C/W out of 11.2 — about 3.5 %. The heatsink-to-ambient term dominates at 71 %.
Enter your own layer thicknesses, materials, and power dissipation to estimate junction temperature rise for your specific design:
[pcb_calc type=”junction-temperature”]
What Changes If You Switch to AlN?
Replacing the 96% alumina substrate with aluminum nitride (AlN) at 170 W/m·K changes only the Rθ_sub term:
Rθ_sub (AlN) = 0.000635 / (170 × 0.000064) = 0.058 °C/W
That saves 0.34 °C/W, dropping T_j from 81 °C to about 79.3 °C. Meaningful in a high-power IGBT module dissipating 200 W — where 0.34 °C/W × 200 W = 68 °C difference — but almost irrelevant for a 5 W LED. The lesson: calculate before you specify. AlN costs 3–5× more than alumina per unit area, and the payoff depends entirely on the power level and the rest of the thermal stack.
| Parameter | 96% Al₂O₃ | AlN | Unit | Condition | Source |
|---|---|---|---|---|---|
| Thermal conductivity | 24–28 | 170–200 | W/m·K | 25 °C, ASTM E1461 | CoorsTek / Maruwa datasheets |
| Rθ_sub (0.635 mm, 64 mm² pad) | 0.35–0.41 | 0.05–0.06 | °C/W | Calculated | Fourier 1-D |
| ΔT_sub at 5 W | 1.75–2.05 | 0.25–0.30 | °C | Calculated | — |
| ΔT_sub at 200 W | 70–82 | 10–12 | °C | Calculated | — |
Typical values for commercially available material, for comparison only. Confirm against the datasheet for your specific grade.
Reducing Rθ with Thermal Vias
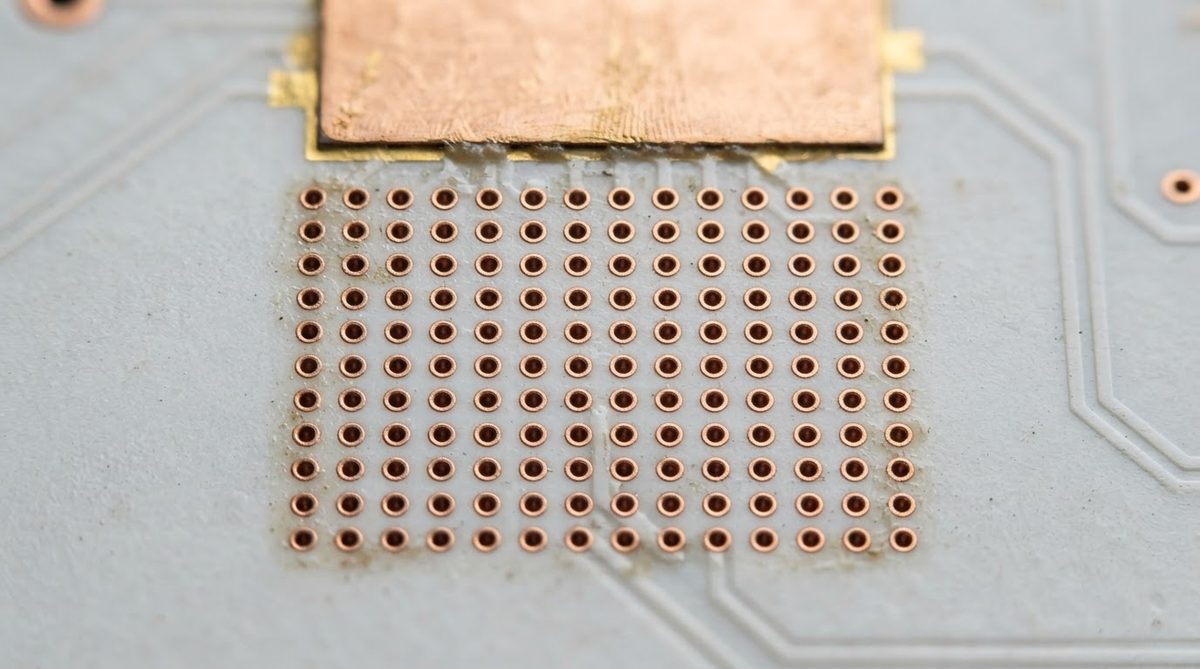
In a multilayer ceramic PCB, heat must pass through internal dielectric layers that add series resistance. Copper-filled thermal vias create parallel conduction paths through those layers.
The thermal resistance of a single filled via is: Rθ_via = t / (k_cu × π × (d/2)²), where d is the via diameter and t is the layer thickness. For a 0.3 mm diameter copper-filled via through a 0.635 mm alumina layer:
Rθ_via = 0.000635 / (390 × π × (0.00015)²) = 23.0 °C/W
One via is not enough. An array of N vias in parallel gives Rθ_array = Rθ_via / N. A 5 × 5 array of 25 vias: Rθ_array = 23.0 / 25 = 0.92 °C/W. That via array acts in parallel with the bulk ceramic (0.397 °C/W for the same area), giving a combined resistance of (0.92 × 0.397) / (0.92 + 0.397) = 0.277 °C/W — a 30 % reduction versus ceramic alone. Increasing via count or diameter improves this further. See optimising thermal via arrays for layout rules and fill options.
Use this calculator to size a thermal via array for your pad geometry and target thermal resistance:
[pcb_calc type=”thermal-via”]
Common Mistakes in Ceramic PCB Thermal Resistance Calculations
Ignoring heat spreading. The 1-D formula assumes heat flows straight down with no lateral spread. In reality, copper planes and the ceramic itself spread heat outward, increasing the effective area A. A 3-D spreading model (David or Muzychka-Yovanovich) gives a lower, more accurate Rθ. The 1-D result is a conservative upper bound.
Using room-temperature k at high operating temperatures. Alumina’s thermal conductivity drops roughly 15–20 % between 25 °C and 200 °C (per Kyocera A-493 datasheet). AlN drops by a similar fraction. If your device runs at 150 °C junction, use k at that temperature, not the headline 25 °C value.
Neglecting the die-attach layer. A 100 µm layer of thermally conductive epoxy (k ≈ 1.5 W/m·K) over a 3 × 3 mm die adds 7.4 °C/W — far more than the ceramic substrate itself. Solder or sintered-silver attach can cut this by 40–100×. Material choice here matters more than substrate choice in many designs.
Forgetting copper thickness effects. Thicker copper (100–300 µm via DBC or plating) improves lateral heat spreading significantly. The copper layer’s own through-thickness resistance is negligible, but its in-plane spreading is not.
When NOT to Use This Approach
The 1-D Rθ stack is a screening tool. It tells you whether a design is in the right ballpark before you invest in simulation or prototyping. Do not rely on it alone in these cases:
- Multiple heat sources close together. Thermal interaction between neighbouring components raises local temperatures. A 1-D model per component will underpredict T_j.
- Transient or pulsed loads. Rθ is a steady-state metric. For pulsed power (e.g., radar, motor drives), you need transient thermal impedance (Zθ) curves, which account for thermal capacitance.
- Very thin substrates (< 0.25 mm). At this thickness, interface resistances and contact pressure dominate, making the bulk ceramic term almost irrelevant.
- When FR-4 or metal-core PCB is sufficient. If your calculation shows T_j is well within limits on a 1.6 mm FR-4 board (k ≈ 0.3 W/m·K), ceramic is an unnecessary expense. Run the numbers on FR-4 first. Switch to alumina or AlN only when the thermal budget demands it.
Frequently Asked Questions
What is a typical thermal resistance for a 1 mm thick alumina substrate?
For 96% Al₂O₃ at 25 W/m·K with a 10 × 10 mm heat source, Rθ = 0.001 / (25 × 0.0001) = 0.40 °C/W. Thinner substrates (0.38 mm, 0.25 mm) reduce this proportionally. The actual value depends on the effective spreading area, which is always larger than the die footprint.
Does thermal resistance change with temperature?
Yes. Thermal conductivity of alumina and AlN decreases as temperature rises. At 200 °C, alumina’s k may drop to 20–22 W/m·K (from 25 at 25 °C), increasing Rθ by roughly 15–20 %. Always use k at your expected operating temperature, not the room-temperature headline value.
Can I just use the Rθ_ja value from the component datasheet?
No. The Rθ_ja on a component datasheet is measured on a specific test board (usually a JEDEC standard FR-4 coupon per JESD51-2). It does not apply to your ceramic PCB, heatsink, or airflow conditions. Use Rθ_jc from the datasheet and calculate the rest of the stack yourself.
How accurate is a 1-D thermal resistance calculation?
A 1-D calculation overestimates Rθ (predicts a higher temperature) because it ignores lateral heat spreading. The error depends on geometry: for a die much smaller than the substrate, the 1-D result can be 30–50 % too pessimistic. Spreading-resistance corrections (Muzychka-Yovanovich, 2001) or FEA simulation close this gap.
Is thermal resistance the same as thermal impedance?
No. Thermal resistance (Rθ) is a steady-state value. Thermal impedance (Zθ) is time-dependent and includes the effect of thermal mass (heat capacity). For constant DC power, Rθ is sufficient. For pulsed or transient loads, you need the full Zθ(t) curve, typically plotted as a Foster or Cauer network in component datasheets.
Where can I find thermal conductivity data for ceramic substrates?
Substrate manufacturers publish this data on their material datasheets. CoorsTek (ADS-96R for alumina, AN-200 for AlN), Kyocera (A-493 series), and Maruwa all provide k values measured per ASTM E1461 (laser flash method). For a side-by-side overview, see our ceramic PCB frequently asked questions.
Next Step
Once your hand calculation confirms the thermal budget is feasible, validate the design with a 3-D FEA model. The spreading resistance corrections and boundary condition details covered in our ceramic PCB thermal simulation setup guide will tighten the accuracy. If you already have a substrate material and stackup in mind, request a quote and our engineering team can review your thermal stackup alongside the manufacturing files.